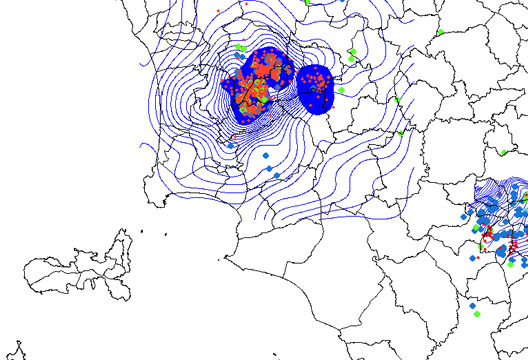
A technology transfer project for the Regione Toscana in order to provide a solution to predict the effects of geothermal power both in the same basin and the surrounding environment in some areas of Tuscany.

Geotherm viewer data visualization
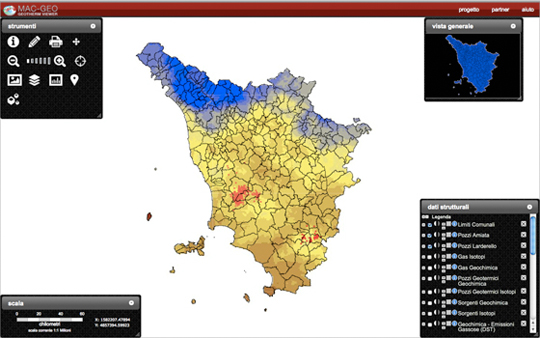
A web application in a GIS environment is designed and developed in order to visualize and query simulation data and their scenarios stored in a geospatial database.

Geotherm Viewer
Project URL: http://macgeo.math.unifi.it/~macgeo/
The MAC-GEO project aims to give the Regione Toscana some simulation tools to predict the effects of geothermal power both in the same basin and the surrounding environment.
The project was funded by Regione Toscana CIPE funds, following the announcement Framework Programme Agreement Research and technology transfer for the production system – Supplementary Agreement III.
The project started in September 2008 and lasts two years.
MICC research staff designed and developed the Geotherm Viewer, a web application in a GIS environment for viewing and querying simulation data and their scenarios stored in geospatial database.
The system was designed for users who need to quickly view the results of the generated simulations in order to assess which groups of data for later analysis and deepen the effects of geothermal both in the same basin and the surrounding environment. In addition, the user-interface provides a set of interactive features for geographic data visualization, data from web map services and information generated by Google Maps.
The Geotherm Viewer has been developed with open source technologies.